Previously we blogged about Vicom Limited’s 2015 full year financial report. At the end of the blog, we highlighted that we would be diving deeper into the fundamentals of Vicom.
Vicom has two major operating segments, vehicle inspection and non-vehicle inspection operations. As the non-vehicle inspection segment is highly fragmented and competitive, Vicom opted to report it together with its vehicle inspection operations.
However, on the other hand, as the vehicle inspection operations are regulated, a lot of information can not only be found from Vicom, but also from other references such as Land Transport Authority (LTA), Comfortdelgro Corporation Limited (CD) and etc.
As we dig deeper into some of these readily available details, here are 4 observations on Vicom’s fundamentals:
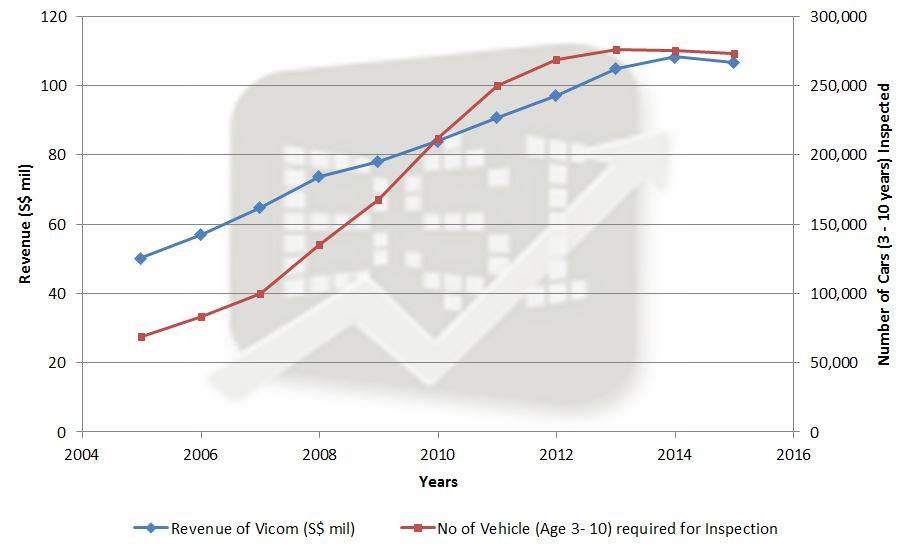
Observation #1 - Vicom’s earnings move in tandem with the vehicles inspected.
Notice the correlation of Vicom’s earnings to the number of vehicles that require inspection. The earnings rise and fall in tandem with the vehicles inspected. Unless there’s a huge game changer from SETSCO, we believe that Vicom’s earnings are relatively pegged to the vehicles inspected.
Observation #2 - Vicom’s earnings are very predictable.
As previously mentioned, Vicom Limited’s business model is pretty boring with little to no drama. This makes Vicom very predictable. Why is this so?
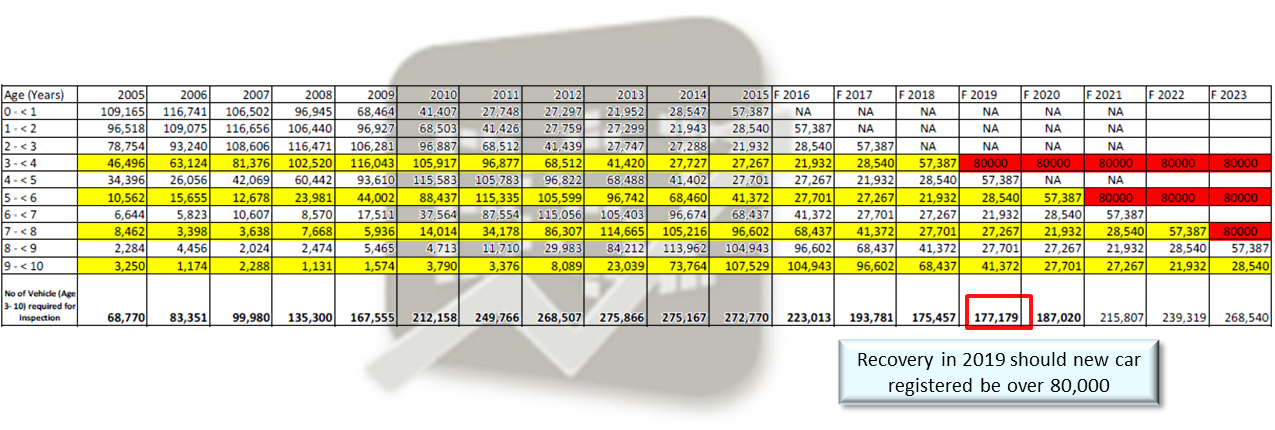
Recall that the government mandates the need for biennial inspection for cars that are 3 - 10 years old, and thereafter, every year after 10th year (highlighted in yellow in the table below).
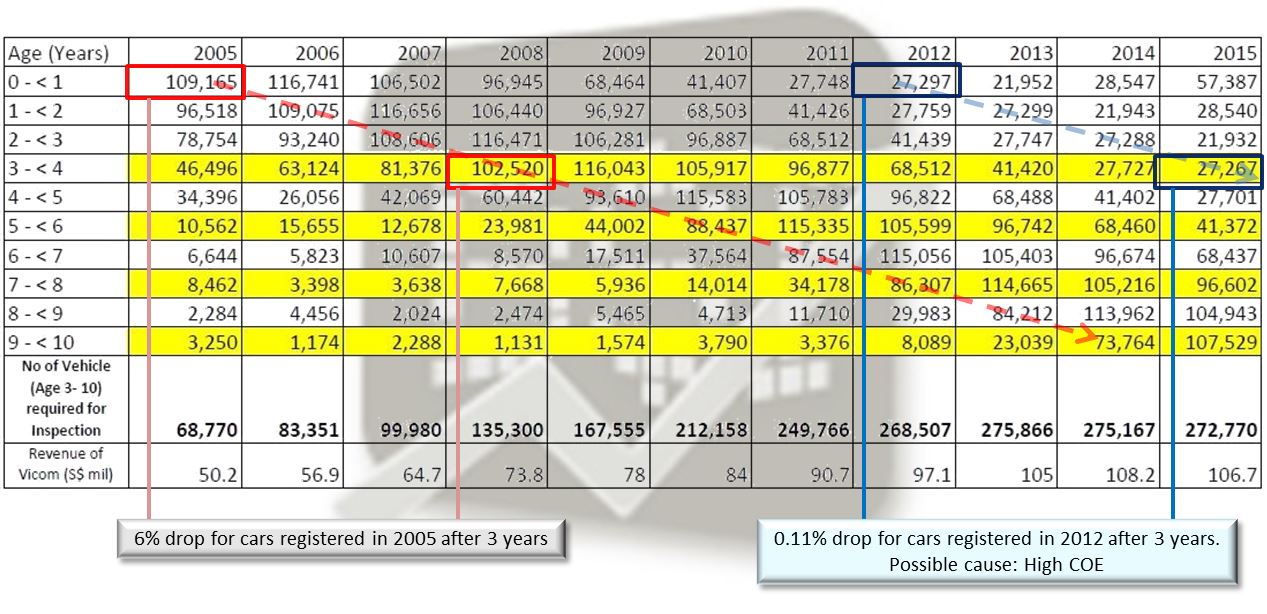 In the past, at a time when COE was very much lower, many Singaporeans opted to repurchase a new car once their existing car reached a certain number of years. However due to the meteoric rise in COE, the cost of replacing a car became very high. As such, people are sticking with their existing cars to maximise their COE dollars. This resulted in the decrease of scrapped cars under 10 years old, translating to more cars requiring inspection. New cars registered will take 3 years before being considered into the inspection pool. By knowing the number of cars registered in 2015, we should be able to estimate the number of cars inspected from now till 2018 with much confidence.
And since we observed that Vicom’s earnings rise and fall in tandem with the vehicles inspected, and we believe we are able to estimate the inspection numbers for the next 3 years, we deduce that Vicom’s earnings in the next 3 years are predictable. So what are the predictions?
Observation #3 - Huge decline in cars inspected from 2016 - 2018.
Based on the table below, with some assumptions and simple projections, the number of vehicles aged 3 - 10 that require inspection drops every year, starting from 2015 till 2018. The biggest drop comes in the year 2016 where total cars that require inspection drops by almost 50,000. This would drastically impact Vicom’s earnings as lesser vehicles would be due for inspection. Furthermore, there will be an approximate drop of 100,000 inspected from 2015 to 2018, translating to a 35% drop.
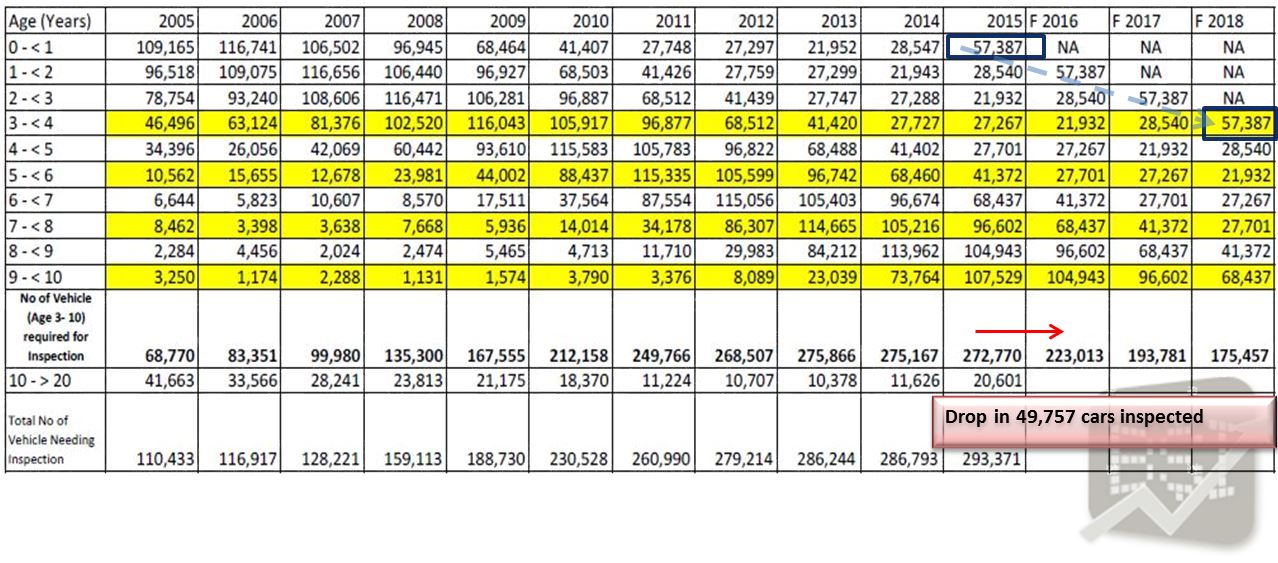
Assumptions for the above observations: With reference to 2015, out of a total of 957,246 vehicles, cars and station wagons make up 62.9% of the vehicle population, at 602,311 vehicles. Since 2010, the cars that require inspection after 10 years old are no more than 10% of the total vehicles that requires inspection. For simplicity sake, we only considered cars with age 3 - 10 years old as they form the bulk of the vehicles that requires inspection. We assumed Vicom’s market share stays constant. We also assumed that due to high COE, very few cars are scrapped before they hit the 10 year mark, as such, we “copied & pasted” the number of vehicles in 2015 to 2016, adding an age older. We repeat the same till 2018, beyond that, we will require the COE released in 2016 to project the cars that require their first inspection on its third year. Any projection beyond 2018 would be meaningless.
Observation #4 - Even with a bumper crop year in 2016, we will only see a fundamental recovery after 2019.
In 2015, about 57,000 new cars were registered. What if, like in 2015, approximately 60,000 new cars were registered consistently after 2016? By 2019, the number of vehicles inspected was projected to be only around 157,000. This is still about 10% lower compared that to our projected 2018 figure of 175,000. In fact, if the government consistently releases 60,000 new COE, and SETSCO maintain constant, we will never see the peak we see in 2013.
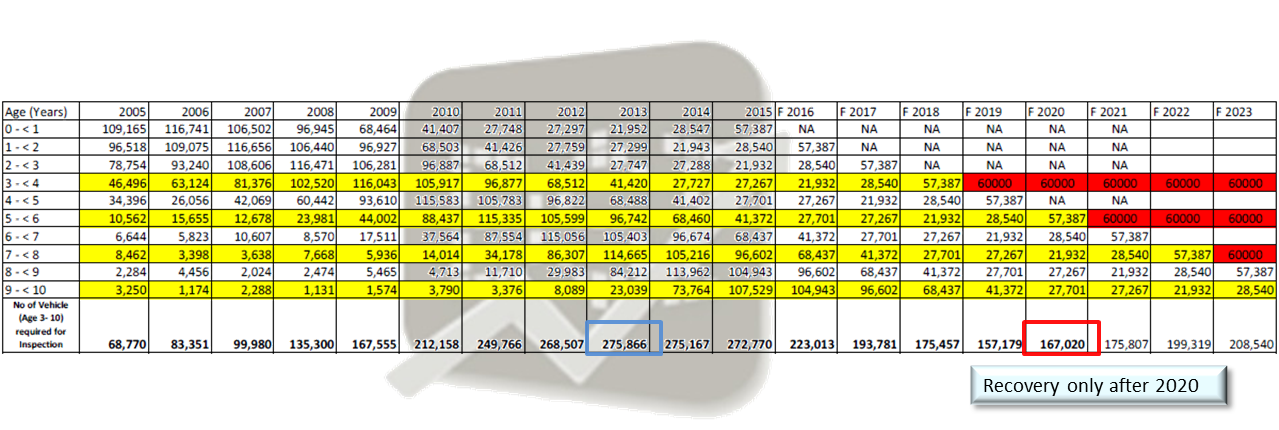
To see a recovery in 2019, new cars registered in 2016 must be more than 80,000. This would result in similar number of cars inspected in our 2018 projected figure. And should new cars be consistently released at 80,000 for the next 5 years, we would see 2013’s peak only in 2023.
 Vicom's fundamentals facing headwinds
With these 4 observations, we foresee Vicom would experience some headwinds. However, the outcome could differ should our assumptions turn out differently. For example, we highlighted that we did not factor in a possible stellar performance of SETSCO, or the possible increase in inspection fees. Also note that, should more owners choose to keep their cars beyond 10 years, it would also positively impact Vicom's earnings.
We hope these numbers would help our readers better understand Vicom and what lies ahead.
If you like our content and think that you have benefitted from our sharing, share this article with your friends and ask them to sign up on our blog or like us on Facebook.
Please leave comments on what you think of Vicom, or what more you would like to about Vicom. We will see how we can answer them.
Meanwhile, stay tuned. We will be posting more analysis from Vicom and other companies.
Some other useful references:
COE bidding in 2009: https://www.lta.gov.sg/content/dam/ltaweb/corp/PublicationsResearch/files/FactsandFigures/COE_Result_2005_2009.pdf
COE bidding in 2012: http://www.lta.gov.sg/content/dam/ltaweb/corp/PublicationsResearch/files/FactsandFigures/COE_Result_2010_2012.pdf